Condition Monitoring Dashboard Software in Machine Sentry
Condition monitoring programmes generate a lot of information. The challenge is not simply collecting more data, but making it easier for the right people to see what matters, understand changes in asset condition and decide what needs attention. That is where configurable dashboards become useful.
Machine Sentry Next Generation allows users to organise condition information into tailored dashboard views, bringing relevant readings, analysis tools, comments and asset information into a workspace that reflects the way reliability teams actually work. Good condition monitoring dashboard software should reduce the distance between data and decision.
Why dashboards matter as monitoring programmes grow
A small condition monitoring programme may be relatively easy to manage. As more assets, sensors, routes and monitoring methods are introduced, the volume of information grows quickly.
Reliability teams may need to review:
- Vibration trends
- Asset condition states
- Alarms and exceptions
- Analysis plots
- Observations and comments
- Maintenance actions
- Information from different sites or asset groups
If all of that information is presented in one fixed view, users can spend more time navigating than interpreting. Configurable dashboards allow the information to be organised around the task at hand.
Different users need different views
A reliability engineer and a maintenance manager may be looking at the same asset population, but they do not necessarily need to see the same information first.
An engineer carrying out detailed diagnosis may want quick access to vibration trends, spectra, waterfall plots and historical measurements.
A maintenance manager may be more interested in assets requiring attention, developing condition changes and actions that need to be planned.
A site or group-level user may need a broader overview across several areas rather than detailed analysis of a single machine.
Condition monitoring dashboard software becomes more useful when these different requirements can be supported within the same platform rather than forcing every user through an identical interface.
Bringing analysis into the same workspace
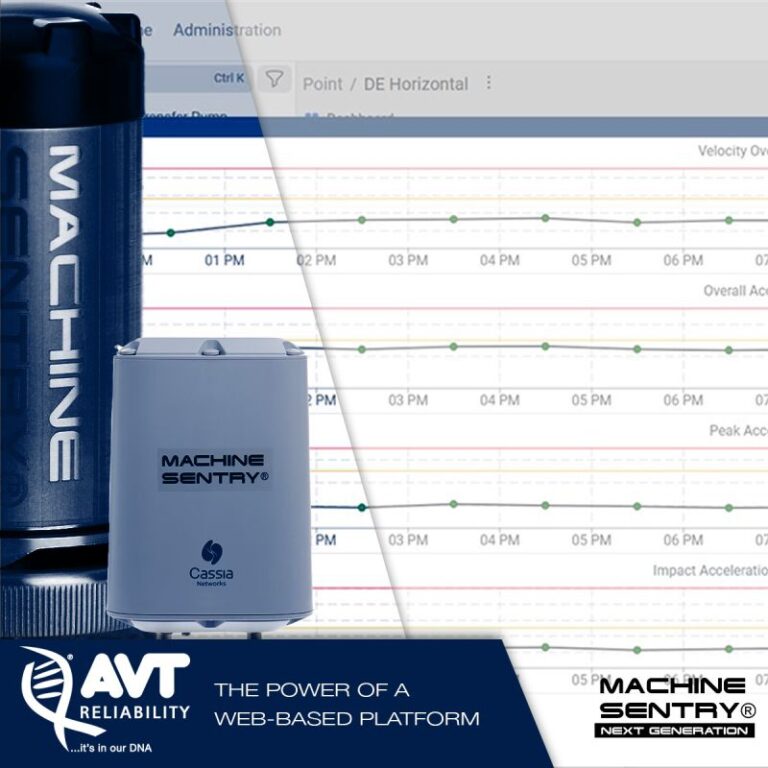
Machine Sentry dashboards can bring condition information and analysis views together so users can move more easily between an overview and the underlying data. Depending on the monitoring activity, that can include asset readings, trend information, analysis plots, comments and other condition data associated with the asset hierarchy.
Waterfall plots, for example, can help engineers review how vibration frequency content changes over time or between operating conditions. The value is not simply having the plot available, but being able to access it within the same environment as the wider asset history. This helps keep interpretation connected to context. Comments help preserve engineering context. Numbers alone rarely tell the whole story.
A change in vibration may coincide with a maintenance intervention, process change, lubrication activity or altered operating condition. Without that context, future users may struggle to understand why a trend changed.Recording comments and observations alongside asset data helps preserve that history. This is particularly useful in long-running monitoring programmes where several engineers may review the same equipment over time. Instead of relying on separate notes or individual memory, important context can remain associated with the monitored asset.
Dashboards should support prioritisation, not just presentation
The purpose of a dashboard is not to make condition data look attractive.
Its job is to make the information easier to use.
A practical dashboard should help users answer questions such as:
- Which assets require attention?
- What has changed since the last review?
- Is the change developing or stable?
- What evidence supports the alarm or concern?
- Has an action already been raised?
- What should be reviewed next?
When dashboards are configured around those questions, they become part of the reliability workflow rather than a passive reporting screen.
Connecting different monitoring methods
Machine Sentry can support condition information generated through different monitoring approaches, including mobile data collection, fixed wireless monitoring and continuous online systems. That means dashboards can form a common viewing layer across a mixed monitoring strategy. This is important because most industrial sites do not need the same monitoring method on every asset.
Critical equipment may justify continuous online monitoring. Other assets may be covered effectively by fixed sensors or periodic route-based measurements. Bringing those methods into a common software environment makes it easier to maintain a consistent view of asset condition while still selecting the monitoring approach that best fits each application.
From dashboard to maintenance action
Condition monitoring only creates value when useful information leads to an appropriate response. A dashboard may highlight a developing change, but the next step still requires engineering interpretation and maintenance judgement.
The practical workflow is closer to:
measurement → review → analysis → decision → action → verification
Dashboard design can support that process by making the relevant evidence easier to find and by keeping asset information organised in one place. The software does not replace engineering judgement. It helps engineers apply that judgement more efficiently.
Building dashboards around the reliability programme
There is no single perfect dashboard layout for every organisation. The most useful configuration depends on the asset population, the responsibilities of the users and the way monitoring activity is reviewed.
A mature programme may benefit from several different views, for example:
- A high-level asset condition overview
- A dashboard focused on assets in alarm
- A site or area-specific view
- An engineering analysis workspace
- A view used for routine review meetings
The important point is that the dashboard should support the reliability process rather than forcing the process to fit the software.
A clearer route from data to decision
Condition monitoring dashboard software is most valuable when it helps teams identify what matters and reach the supporting evidence quickly.
Machine Sentry Next Generation combines configurable dashboards with condition data, analysis tools and asset history to give reliability teams a more usable environment for reviewing monitored equipment. Used alongside the wider Machine Sentry Product Suite and AVT Reliability engineering support, dashboards can help organisations manage growing condition monitoring programmes without losing sight of the decisions the data is meant to support.